Splashv2: Automating Large-Scale Traceroute Ingestion
A scalable system for automating traceroute ingestion and analysis, built for Aqualab at Northwestern University.
Abstract
Aqualab at Northwestern University conducts research on large-scale networks and distributed systems. In Internet measurement studies, researchers often analyze traceroute data to study the geographic and organizational flow of Internet traffic. RIPE Atlas is one valuable resource for obtaining large volumes of traceroute measurements, but prior to this project, graduate students were required to write and maintain their own traceroute-ingestion pipelines. This manual process typically consumed days of effort, involving custom scripts to fetch measurements, manage large JSON datasets, and manually handle storage and annotation.
I developed Splashv2, with two primary goals: scalability and ease of use. Rather than writing custom ingestion logic, researchers can now simply provide input parameters and click “Materialize All.” Splashv2 automatically fetches, parses, annotates, and loads traceroutes into ClickHouse. Grafana is integrated with ClickHouse to enable researchers to instantly query historical traceroutes and generate visualizations in seconds, freeing them to focus on research and papers, not pipelines.
Background Information
A traceroute is a network diagnostic tool that reveals the sequence of routers (hops) that packets traverse to reach a destination on the Internet. Each hop typically corresponds to a router or switch along the path, and by analyzing these hops, researchers can study the geographic and organizational flow of Internet traffic.
RIPE Atlas is a global Internet measurement platform operated by the Réseaux IP Européens Network Coordination Centre (RIPE NCC). It consists of thousands of volunteer-contributed probes deployed worldwide. Whenever a host connects a RIPE Atlas probe, the probe automatically begins executing a set of predefined built-in measurements. These built-in measurements include ping, traceroute, DNS, SSL/TLS, and some HTTP measurements, typically targeting well-known infrastructure such as DNS root servers and RIPE Atlas components.
Each measurement ID corresponds to a particular target and measurement type. For example, a measurement ID might define a recurring traceroute to a specific domain. Researchers retrieve measurement results through the RIPE Atlas API by referencing these measurement IDs. The API returns raw traceroute data, including the list of IP addresses observed at each hop. However, it does not provide additional contextual information that is often useful for research, such as the geolocation of each hop (city, region, country), or the Autonomous System Number (ASN) and corresponding ASN name. As part of the Splashv2 pipeline, these additional annotations are added to each traceroute hop using the IPinfo, enriching the dataset.
Architecture and Design
Splashv2 consists of four main components: a Dagster orchestrator, a PostgreSQL metadata store, a ClickHouse traceroute store, and Grafana for visualization. The entire workflow is defined as a single Dagster job. Researchers provide input parameters—countries, RIPE Atlas measurement IDs, time window, and node limits—and initiate the pipeline. Splashv2 then fetches, parses, annotates, and loads traceroute data into ClickHouse, with relevant metadata stored in PostgreSQL. Data flow, retry logic, and error handling are fully managed within the Dagster pipeline.
All components run in Docker containers and are deployed via Docker Compose on lisa.cs.northwestern.edu. Pipeline parameters and Dagster configuration are defined in a YAML config file, while sensitive information such as database credentials is injected via environment variables. Throughout execution, Dagster emits metadata (including record counts and stage timings) and logs, which can be inspected in the Dagster UI. Once data is loaded, researchers use Grafana dashboards, linked to ClickHouse, to perform exploratory queries and visual analyses of traceroute data.
Data Storage Design and Scalability
ClickHouse was selected as the primary data store for traceroutes because Splashv2’s workload is large, read-heavy, and append-only. The columnar storage model of ClickHouse provides excellent performance for analytical queries, enabling fast aggregations and low-latency filtering over millions of rows. This design ensures that the system can scale gracefully as data volumes grow.
Designing around this workload profile introduces certain tradeoffs. For example, duplicates can exist in the traceroute table, particularly when re-ingesting measurements. Rather than enforce strict deduplication at ingestion time, Splashv2 records an inserted_at timestamp with each row. Downstream queries can then be written to select only the most recently inserted traceroute per probe, allowing users to easily handle duplicates at query time while maintaining ingestion performance.
Performance and Scalability
Splashv2 is capable of handling large-scale traceroute ingestion. To evaluate its performance, I ran the following pipeline configuration:
ops:
  ripe_ingestion:
    config:
      countries:
        - SG
      from_ts: 2025-01-01
      max_n_probes: 100
      msm_ids:
        - 5051
        - 5151
      to_ts: 2025-05-20
This configuration ingested 1,619,776 traceroutes over a time window spanning several months. The complete pipeline took 56 minutes and 2 seconds to execute. The majority of this time (approximately 47 minutes) was spent fetching data from the RIPE Atlas API. The remaining time was used for parsing, annotating, and loading the traceroutes into ClickHouse.
Splashv2 employs several techniques to achieve high performance at scale:
- Parallelization: CPU-intensive tasks, such as the geolocation of traceroute hops, are parallelized across multiple cores. This optimization led to an 86% decrease in latency for the geolocation stage compared to a serial implementation.
- Database Optimization: Moving from PostgreSQL to ClickHouse for traceroute storage yielded an 80.7% improvement in ingestion latency. In addition to faster inserts (due to batched ingestion), ClickHouse’s columnar storage model is well-suited for Splashv2’s workload, which is large, read-heavy, and append-only. This enables fast aggregation and low-latency queries even over millions of rows, outperforming traditional row-based databases like PostgreSQL for this use case.
- Caching: The RIPE Atlas API is a significant bottleneck during ingestion. To mitigate this, Splashv2 caches reusable data where possible. For example, probe metadata for each country is typically stable over time. Rather than repeatedly querying the RIPE Atlas API, Splashv2 caches probe information locally to avoid redundant API calls.
Example Research Application
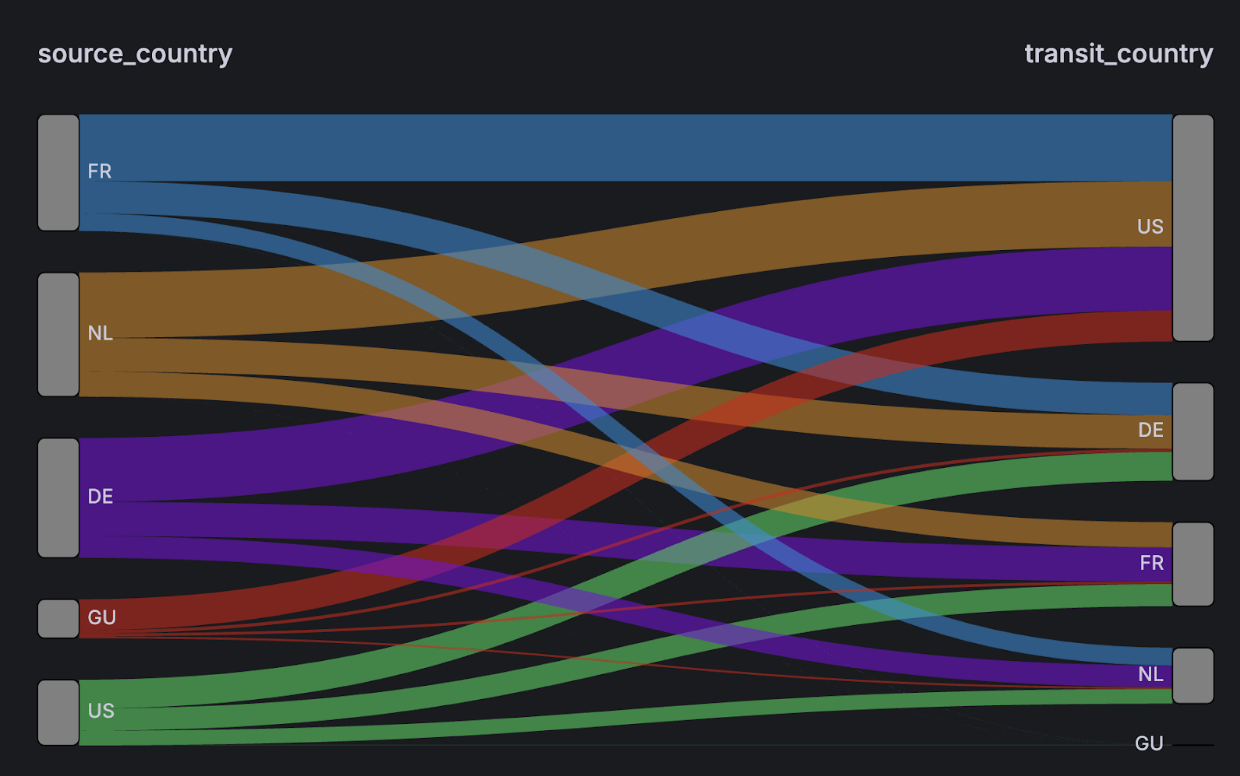
Splashv2 streamlines execution of Internet-measurement studies by reducing multi-day workflows to a few clicks. Consider the academic research question:
To what extent does country A’s Internet traffic depend on country B for transit?
Answering this traditionally requires writing data-ingestion scripts, geolocation traceroute hops, loading JSON outputs, and manually constructing visualizations. These efforts can consume days of development and debugging. With Splashv2, researchers simply specify a list of countries, RIPE Atlas measurement identifiers, a time interval, and then invoke the pipeline. Splashv2 automatically retrieves and annotates millions of traceroutes, persisting both raw traces and metadata in ClickHouse, and exposes query-ready tables. A single SQL-style query then produces the frequency of source-transit country hops, and Grafana renders the results as a Sankey diagram. This end-to-end automation transforms what was once a labor-intensive process into an immediate, reproducible analysis.
Future Work
A potential next step is to extend Splashv2 to support real-time ingestion of traceroute data. While the current system operates in a batch mode, RIPE Atlas offers a streaming API, and adapting Splashv2 to leverage these would enable researchers to analyze network behavior with much lower latency. A real-time ingestion pipeline would further enhance the system’s utility for monitoring and time-sensitive studies.
Expanding the types of measurements ingested is another priority. Integrating pings alongside traceroutes would provide round-trip-time data, enriching analyses of latency and path stability. Finally, to support ever-growing datasets and heavier workloads, migrating from a Docker Compose setup to a cloud-native deployment (for instance on Kubernetes or managed container services) would enable auto-scaling, high availability, and more seamless resource management.
Conclusion
Splashv2 significantly improves the workflow for conducting large-scale Internet measurement studies within Aqualab. By automating traceroute ingestion, annotation, and storage, the system reduces what was previously days of manual effort to a process that can be completed in under an hour with asynchronous ingestion and interactive querying. Researchers can now easily ingest and analyze millions of traceroutes with minimal setup, enabling faster iteration and deeper exploration of network behavior.
While the system already supports batch ingestion at scale, future work will focus on extending Splashv2 to support real-time ingestion and additional measurement types such as pings. Migration to a cloud-native deployment will further enhance scalability and robustness.
Splashv2 provides a flexible and powerful platform that will help enable Aqualab researchers to deliver new insights into the structure and dynamics of the Internet.
Thanks to Caleb Wang, Santiago Klein, and Professor Fabián Bustamante for their guidance and feedback on this project.